Technical background of
the
Ascent Volatility
Trading Program
The expected volatility of the
S&P500 stock market index is measured by the volatility
index VIX of the CBOE. It is calculated as the implied volatility of a
basket of call and put options on the S&P500 index.
In times of crisis, the volatility
index VIX tends to go up. Some stock market participants try to
use the VIX to hedge their portfolios.
It is not possible to invest
directly in the Volatility Index VIX, but futures on the VIX are
traded since 2004. Market participants can use these as stock portfolio
insurance.
Futures introduce a new element in
the investment equation: the presence of either contango or
backwardation. Contango means that futures contracts further
away in time are more expensive than closer futures contracts.
Backwardation means the opposite, i.e. futures contracts further
away in time are cheaper than closer futures contracts.
From Wikipedia
:
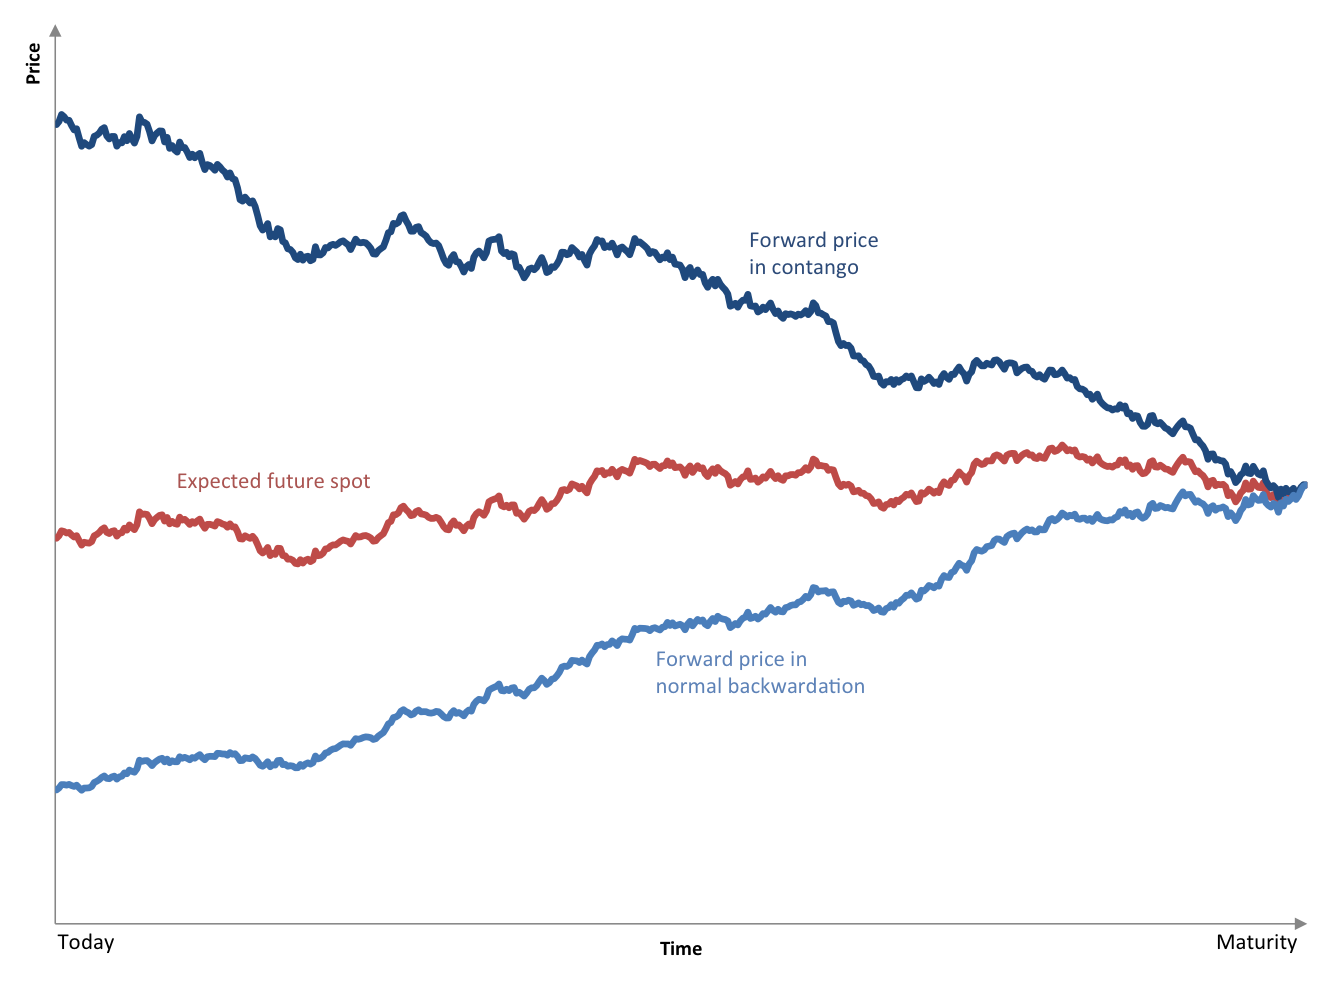
The
graph depicts how the price of a single forward contract will behave
through time in relation to the expected future price at any point
time. A contract in contango will DEcrease in value until it equals the
spot price of the underlying at maturity. A contract in backwardation
will INcrease in value until it equals the spot price of the underlying
at maturity.
Most of the time, the VIX futures
market has been in contango, which means that e.g. futures
contracts 2 months out are more expensive than futures contracts
one month out. Market participants pay a premium for further out
volatility contracts, to protect themselves against unforeseen market
deterioration. The further away in the future, the more difficult it is
to predict market turmoil, and the higher the need for volatility
protection. This protection can be very expensive though.
Regularly, the price of the second month VIX future contract has
been 10% higher than the first month contract. If nothing spectacular
happens, and the VIX stays roughly constant during that month, the
buyer of the 2nd month VIX future loses 10%. The seller of the future
would have earned 10%. A long position (buying the future) must
overcome the contango price hurdle before it becomes profitable. A
short position (selling the future) has an easier time becoming
profitable in a contango situation.
The inverse holds in a backwardation
situation, where the second month volatility future is cheaper than the
first month future. This may happen after a large volatility spike,
where market participants expect the volatility to decrease further out
in time. As an example of a transaction in this situation:
suppose the second month future is 10% cheaper than the first month
future. If the market situation does not change, and the VIX
stays roughly constant during that month, the buyer of the second month
future VIX future would earn 10%. The seller of the future would have
lost 10%. A long position (buying the future) has an easier time
becoming profitable in a backwardation situation. A short position
(selling the future) must overcome the backwardation price hurdle
before it becomes profitable.
Since a couple of years, there
are Exchange Traded Notes (ETN) and Exchange Traded Funds (ETFs)
available on the stock market that invest in VIX futures, such as funds
VXX, XIV, VXZ, ZIV, VIXY, SVXY and UVXY.
In our volatility trading strategy,
we use proprietary indicators to determine when to go long or short
volatility.
Since 2004, the average price for "volatility
portfolio insurance" (contango between the first and second month
VIX future) is more than 5% per month, which translates to about
80% per year. Since the VIX is a mean-reverting index, an almost
constant expectation of growth is not realistic. Most of the time,
money can be made selling volatility insurance. Even if
we would sometimes mistime volatility spikes (for example during a
sudden crisis such as the 9/11 attack), and be short volatility at the
wrong time, a premium of 80% per year, provides a lot of buffer against
mishaps.
This is a speculative investment strategy, and only suitable for
investors who accept increased risk (including the possibility of
losing the entire investment), in exchange for possible increased
returns.
Comparison
against a simple volatility insurance selling strategy
Our positions are often equivalent to
selling volatility insurance, and one may wonder what the risk of such
a strategy is.
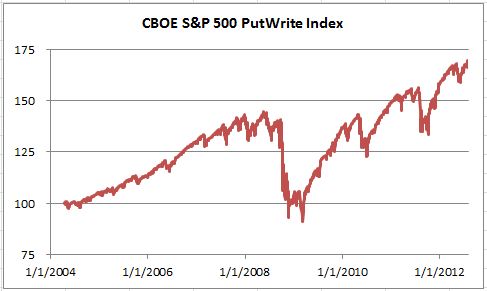
The CBOE S&P 500 PutWrite
Index represents a simple volatility insurance selling strategy. It
measures the performance of a hypothetical portfolio that sells S&P
500 Index (SPX) put options against collateralized cash reserves held
in a money market account.
Most of the time, the realized
volatility is lower than the volatility implied by the put option
prices, and a nice risk premium can be harvested. From time
to time, there are large stock market corrections, and the "insurance"
needs to be paid out, lowering the return of the strategy. Even after
the payouts, the strategy is still profitable, as the graph below shows.
In contrast, the Ascent Volatility
Trading Program relies on a different volatility insurance vehicle: it
uses VIX
futures, which represent a prediction of the price of S&P 500
options. The options by itself already contain a risk premium;
predictions of option prices contain an even higher risk premium that
can be harvested. The results of this approach are much better.
Note: past performance is not
necessarily indicative of future results. The value of your investment
can go up or down.
(1) Please note that
in extreme market circumstances, prices may drop beyond the stop
loss before a sell order gets executed. Large sudden price drops
are still possible.
|